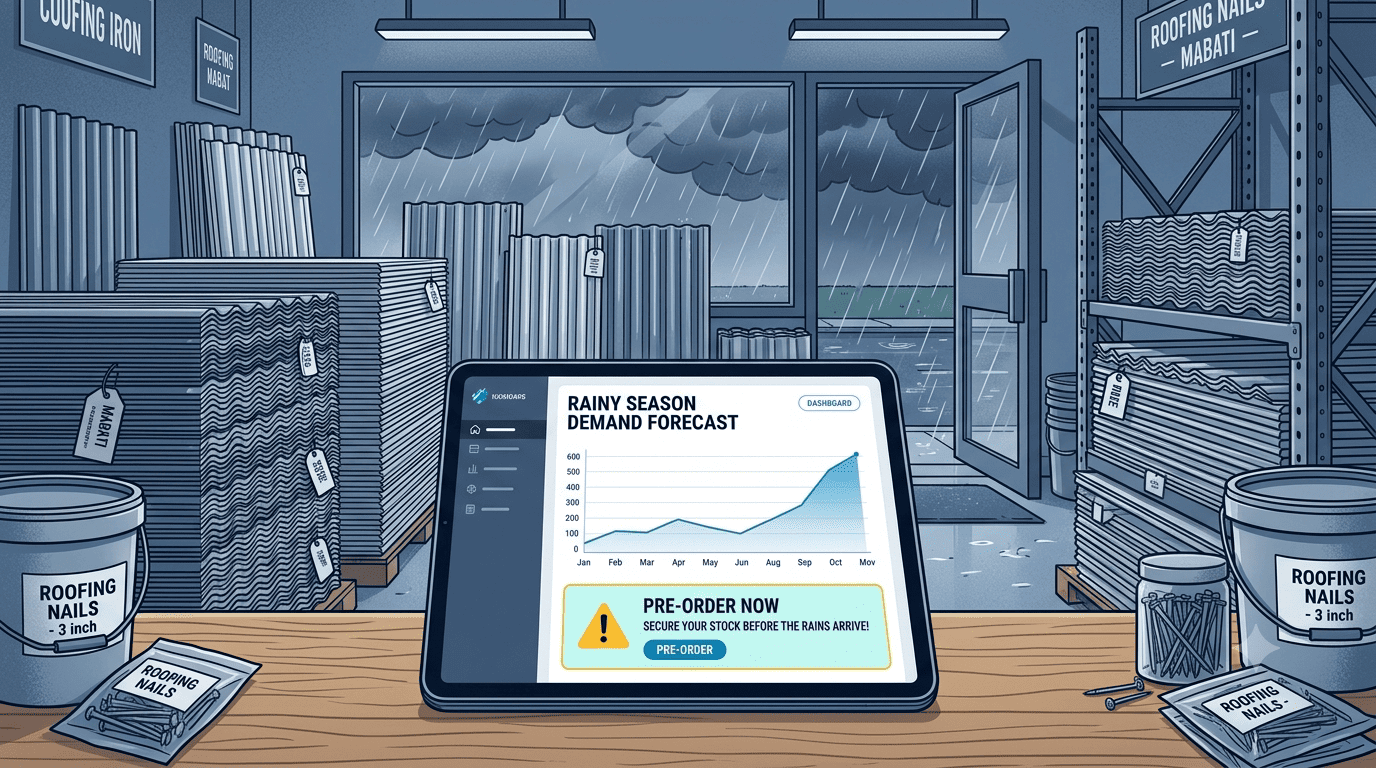
Predicting the Rush Before the Rain
Every year, when the heavy rains hit Nairobi, hardware stores are swamped with customers desperate for mabati, nails, timber and waterproofing materials. Some stores run out in the first week and lose sales.
Some overstock and sit on unsold inventory when the rains are light. A hardware store in Industrial Area started using historical sales data to predict exactly how much emergency roofing stock to pre-order each season.
A hardware store in Industrial Area
The change was not a bigger shop or a bigger budget. It was the decision to look backwards at three years of sales data and prepare forwards for the season everyone else reacts to.
Caught by the season
- Order placed after the first downpour
- Stock arrives when demand is falling
- Sold out during the peak week
- Or overstocked in a light season
- Cash tied up in the wrong items
Ahead of the season
- Forecast built from three years of data
- 80 percent pre-ordered before the rains
- Stock on shelf during the peak week
- Buffer sized to the forecast
- Cash working instead of sitting
How the seasonal demand model works
Four steps, all of them built from data you already have in your dashboard. Nothing here requires new software or a consultant.
Analyse three years of rainy season sales
Pull sales data from the dashboard for March to May and October to November, Kenya's rainy seasons, for the last three years. Look at specific items, not categories: mabati, nails, timber, waterproofing compounds.
What to calculate The average monthly sales for each item during those periods. Three years smooths out one unusually heavy or light season.Identify the trigger event
He noticed a pattern: sales did not spike on the first day of rain. They spiked about three to five days after the first heavy downpour, when leaks became apparent and roofs started showing damage.
Why this matters That gap is your lead time. Demand is caused by damage becoming visible, not by rain falling, and that delay is predictable.Pre-order based on forecasted demand
Based on the historical average, adjusted for known factors such as new construction in the area, he pre-ordered an estimated 80 percent of forecasted demand about two weeks before the expected rains, and kept a small buffer.
The two stage approach When the first heavy rain hit, he placed a rush order for the remaining 20 percent based on real time demand signals. The forecast covers most of the season, the data covers the rest.Adjust pricing dynamically and ethically
Because he had stock when others did not, he did not price gouge. He implemented a modest seasonal pricing adjustment of 5 to 10 percent to reflect the increased procurement and storage costs.
Why customers accepted it Customers were willing to pay because he had availability when they were desperate. The premium paid for reliability, not for desperation.The timeline that makes it work
The whole model lives in the gap between the forecast and the trigger. Here is the season in order.
Two weeks ahead of the trigger
- Two weeks before expected rains80 percent of forecasted demand is ordered and on the shelf.
- First heavy downpourDemand stays flat for a few days. Nothing spikes yet.
- Three to five days laterLeaks become visible, roofs show damage, and the spike begins.
- During the spikeA rush order covers the remaining 20 percent, sized by real time signals.
- Through the seasonSeasonal pricing of 5 to 10 percent reflects real procurement and storage costs.
The data driven advantage
By using historical data to anticipate demand, he turned the rainy season from a chaotic scramble into a planned, profitable period. He served his community when they needed him most, and his business thrived.
Three years of rainy season sales, one trigger event, one two stage order, and one modest seasonal price adjustment. That is the whole model.
The season is predictable. The only question is whether you forecast it or react to it.
Ready to forecast your next season?
Stonehenge Digital builds business management systems with sales history by item and period, seasonal reports and reorder alerts, so you can pre-order with evidence instead of guessing.
Analyse My Seasonal Demand →Interested in Business Management System?
Let's build this for your business
Replace spreadsheets, paper records, and WhatsApp chaos with a custom system built for exactly how your business works.