The Lean Months Are Predictable (So Prepare for Them)
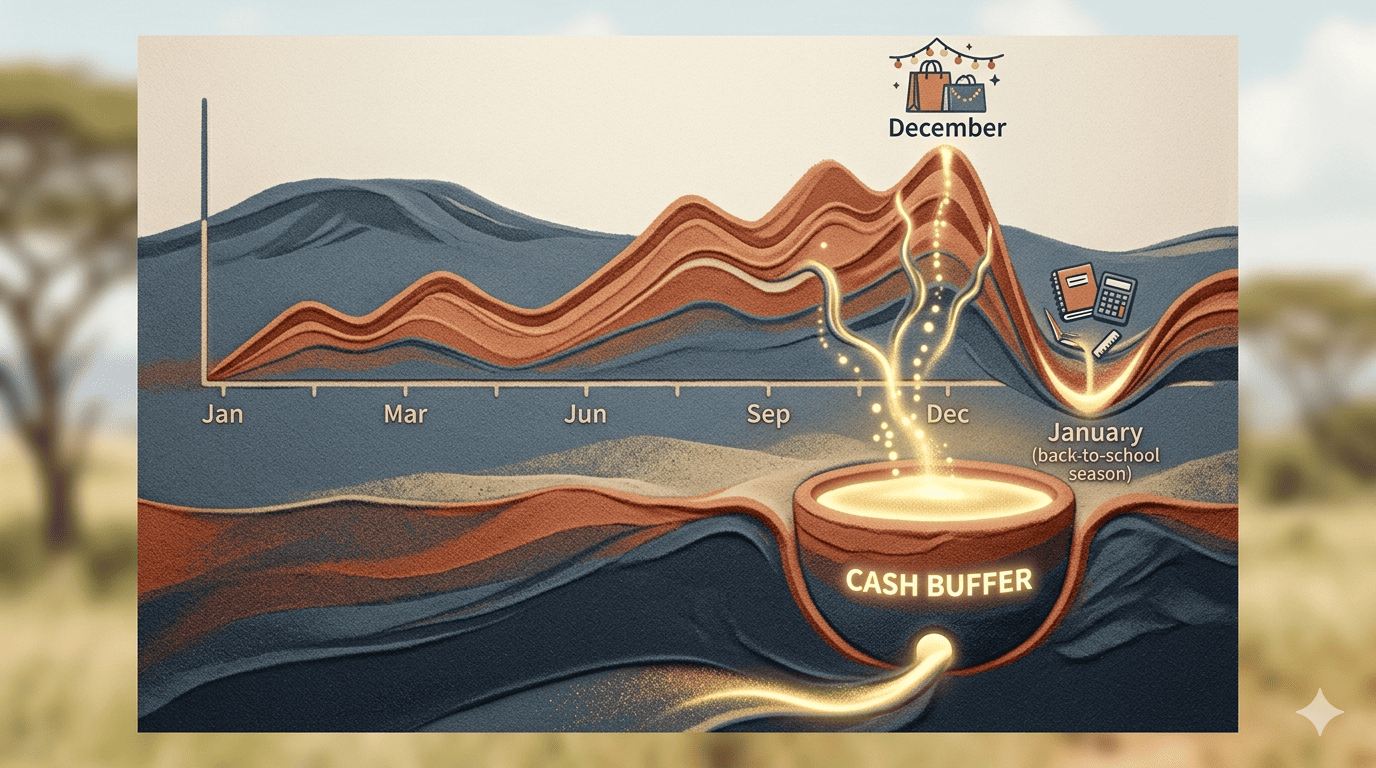
Every Kenyan business owner knows the rhythm: Sales surge in December (bonuses, festivities), then crash in January (school fees, survival mode). There's a slight bump around Easter, a quiet mid-year, an election-year uncertainty, and a gradual climb back to the holiday peak. This seasonal cash flow pattern is as reliable as the rains.
Yet, most SMEs are caught off guard every January, scrambling for cash and taking expensive short-term loans. A Stonehenge Digital dashboard changes this by giving you forecasting power, not just historical reporting.
How to Build a Seasonal Cash Flow Forecast
Step 1: The 12-Month Revenue View
Your dashboard automatically graphs sales (from M-Pesa, cash, bank transfers) month by month for the past 12-24 months. Superimpose a simple moving average trendline. This reveals your seasonal peaks and troughs clearly.
- Example: You see that January sales are consistently 50% of December sales. You now know this is the "norm," not a failure.
Step 2: The "Fixed Cost" Watermark
Overlay your average monthly fixed costs (rent, salaries, loan repayments, internet) as a flat line on the same chart. You can instantly see the months where revenue dips below the cost line. These are your danger months. For most Kenyan SMEs, that's January, and possibly May/August.
Step 3: The Cash Buffer Calculator
The dashboard calculates the total forecasted cash shortfall for the danger months. It tells you: "You need a KES 120,000 cash buffer to cover January's fixed costs based on the forecasted 40% revenue dip."
Step 4: Automated Buffer Building
Starting from high-revenue months (e.g., November/December), the dashboard suggests a weekly savings transfer amount: "Transfer KES 10,000 to your Cash Reserve Fund this week." You can set up an automatic transfer from your business M-Pesa to a locked savings account (e.g., M-Shwari Lock or a bank fixed deposit) directly via the dashboard interface.
Beyond Seasonal: Special Events Forecasting
Add calendar markers: "August 2026 – General Election (Expected slow business climate)," "March 2026 – School Fee Season (Reduced consumer spending)." Your dashboard can incorporate these qualitative markers for a richer forecast.
The Psychological Benefit: From Panic to Control
When the slump hits, you don't panic. You look at the dashboard and see: "Revenue is down 45% this January... exactly as forecasted. The buffer is already in place. Salaries are covered. Keep selling, focus on low-cost marketing." This is the difference between reactive stress and proactive management.
Predict your lean season. Build the ark before the rain.
Interested in Business Management System?
Let's build this for your business
Replace spreadsheets, paper records, and WhatsApp chaos with a custom system built for exactly how your business works.