The Meat That Goes to Waste
A butchery in Umoja was throwing away unsold meat worth KSh 1,500 every single day. The owner guessed how much to stock each morning based on gut feel. Some days he ran out by 2 PM. Other days, he had a fridge full of unsold meat at closing.
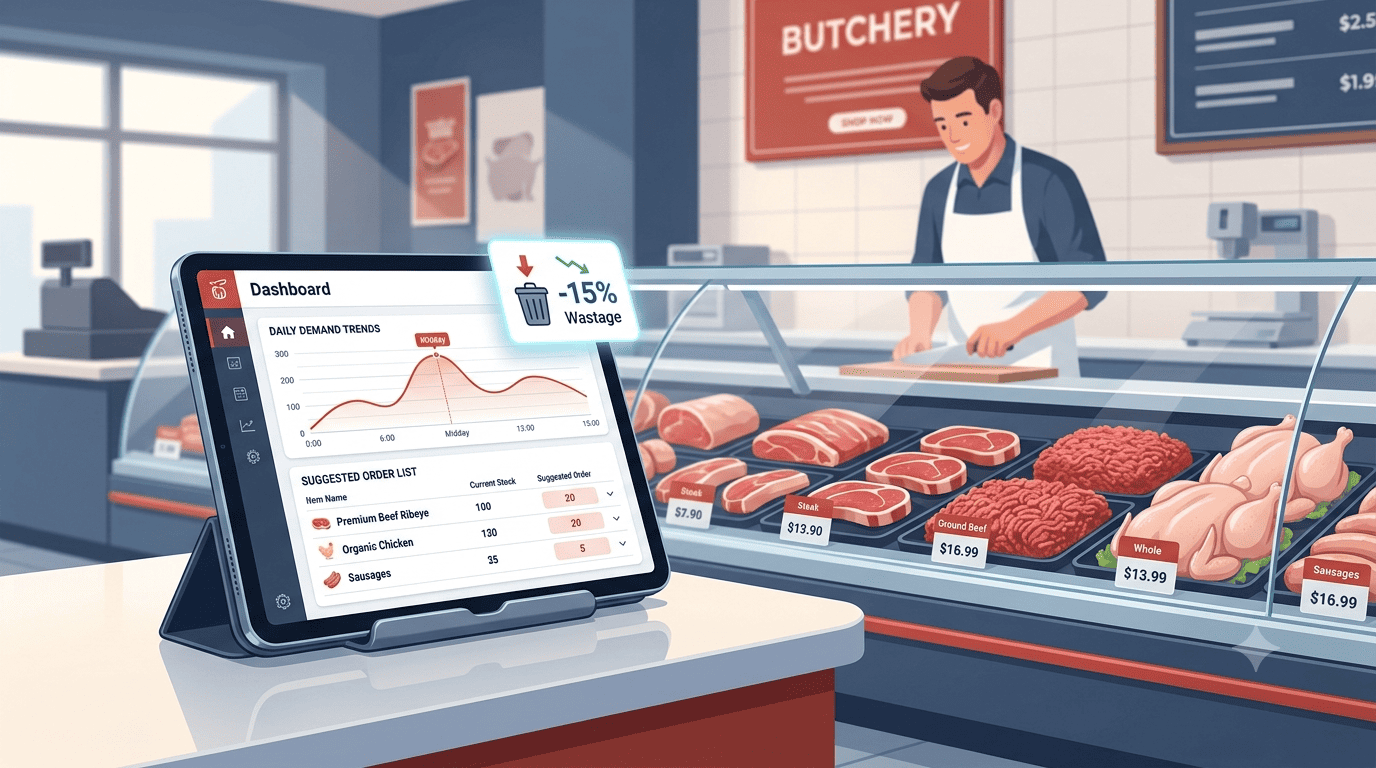
He started using a simple Stonehenge Digital dashboard. Every sale, every cut of meat, was recorded at the point of sale. After one month, the dashboard revealed a clear pattern: specific cuts sold better on specific days, and overall demand varied predictably through the week.
Stocking by gut feel
- KSh 1,500 thrown away daily
- Running out by 2 PM on busy days
- Fridge full of unsold meat on slow days
- Invisible day-to-day patterns
- Losing KSh 45,000 every month
Stocking by demand
- Wastage cut by over 60%
- Right cuts on the right days
- Stock-outs reduced significantly
- Clear Friday, Saturday patterns
- Saving KSh 27,000 monthly
How the butchery dashboard works
Four steps that turned a daily guessing game into a precise, data-driven operation.
Record each cut sold
Using a simple POS interface (a tablet with barcode scanner or touchscreen buttons for each meat type), the butcher records every sale: 2 kg beef, 1 kg goat, 1 whole chicken, etc.
The foundation The dashboard logs the date, time, and item for every single transaction, building a reliable history.Generate the "Daily Demand by Cut" report
After a month, the dashboard shows a clear table: average kg sold per day for each meat type. Even more valuable, it shows day-of-week patterns.
The pattern revealed Goat meat sells better on Fridays (payday/parties), chicken is steady throughout the week, beef spikes on Saturdays. These patterns were invisible before.The smart order suggestion
Based on historical demand, the dashboard suggests a daily stock order, adjusting for the day of the week and adding a small buffer.
An example "Based on your average Friday sales over the last 4 weeks, we recommend ordering: 15 kg beef, 10 kg goat, 8 whole chickens. This should meet demand with a 10% buffer."The wastage tracker
At closing, any unsold meat that must be discarded is recorded as "Wastage - Spoilage." The dashboard tracks this as a percentage of total stock.
The accountability loop The owner can see his wastage rate trending down over time, and can investigate any sudden spikes.The financial impact
A small amount of data analysis can eliminate a massive daily loss. Here is what the numbers looked like.
From Wastage to Savings
Cutting that daily loss by 60% saves KSh 27,000 every month. That is almost the cost of a full-time employee. The data also allowed the butcher to stock more of the popular cuts, increasing sales by reducing stock-outs.
A daily loss of KSh 1,500 does not feel like a crisis in the moment, but over a month it drains your profit.
Let your sales data tell you exactly what to stock each day. Stop guessing, and start saving.
Ready to stop throwing away profit?
Stonehenge Digital builds business management systems with POS integrations, daily demand forecasting, and wastage tracking, so your perishable inventory is always optimized.
Build My Perishable Inventory System →Interested in Business Management System?
Let's build this for your business
Replace spreadsheets, paper records, and WhatsApp chaos with a custom system built for exactly how your business works.